

History Shows the Housing Market Always Recovers

History Shows the Housing Market Always Recovers

Now that the market is slowing down, homeowners who haven’t sold at the price they were hoping for are increasingly pulling their homes off the market. According to the latest data from Realtor.com, the number of homeowners taking their homes off the market is up 38% since the start of this year and 48% since the same time last June. For every 100 new listings in June, about 21 homes were taken off the market.
And if you’ve made that same choice, you’re probably frustrated things didn’t go the way you wanted. It’s hard when you feel like the market isn’t working with you. But while slowdowns can be painful in the moment, history tells us they don’t last forever.
History Repeats Itself: Proof from the Past
This isn’t the first time the housing market has experienced a slowdown. Here are some other notable times when home sales dropped significantly:
- 1980s: When mortgage rates climbed past 18%, buyers stopped cold. Sales crawled for years. But as soon as rates came down, sales surged back, and the market found its footing again.
- 2008: The Great Financial Crisis was one of the toughest housing downturns in history. Sales and prices both dropped hard. Still, sales rebounded once the economy recovered.
- 2020: During COVID, sales disappeared overnight, and many people had to put their plans on hold. Yet the recovery was faster than anyone expected, with a surge of buyers re-entering the market as soon as restrictions eased.
The lesson is clear: no matter the cause, the market always rebounds.
Today’s Situation: Where We Stand Now
Over the past few years, home sales have been sluggish. And one big reason why is affordability. Mortgage rates rose at a record-breaking pace in 2022, and home prices were climbing at the same time. That combination put buying out of reach for many people. And when demand slows, home sales do too.
The Outlook: Why Things Will Improve
But here’s the encouraging part. Forecasts show sales are expected to pick up again moving into 2026.
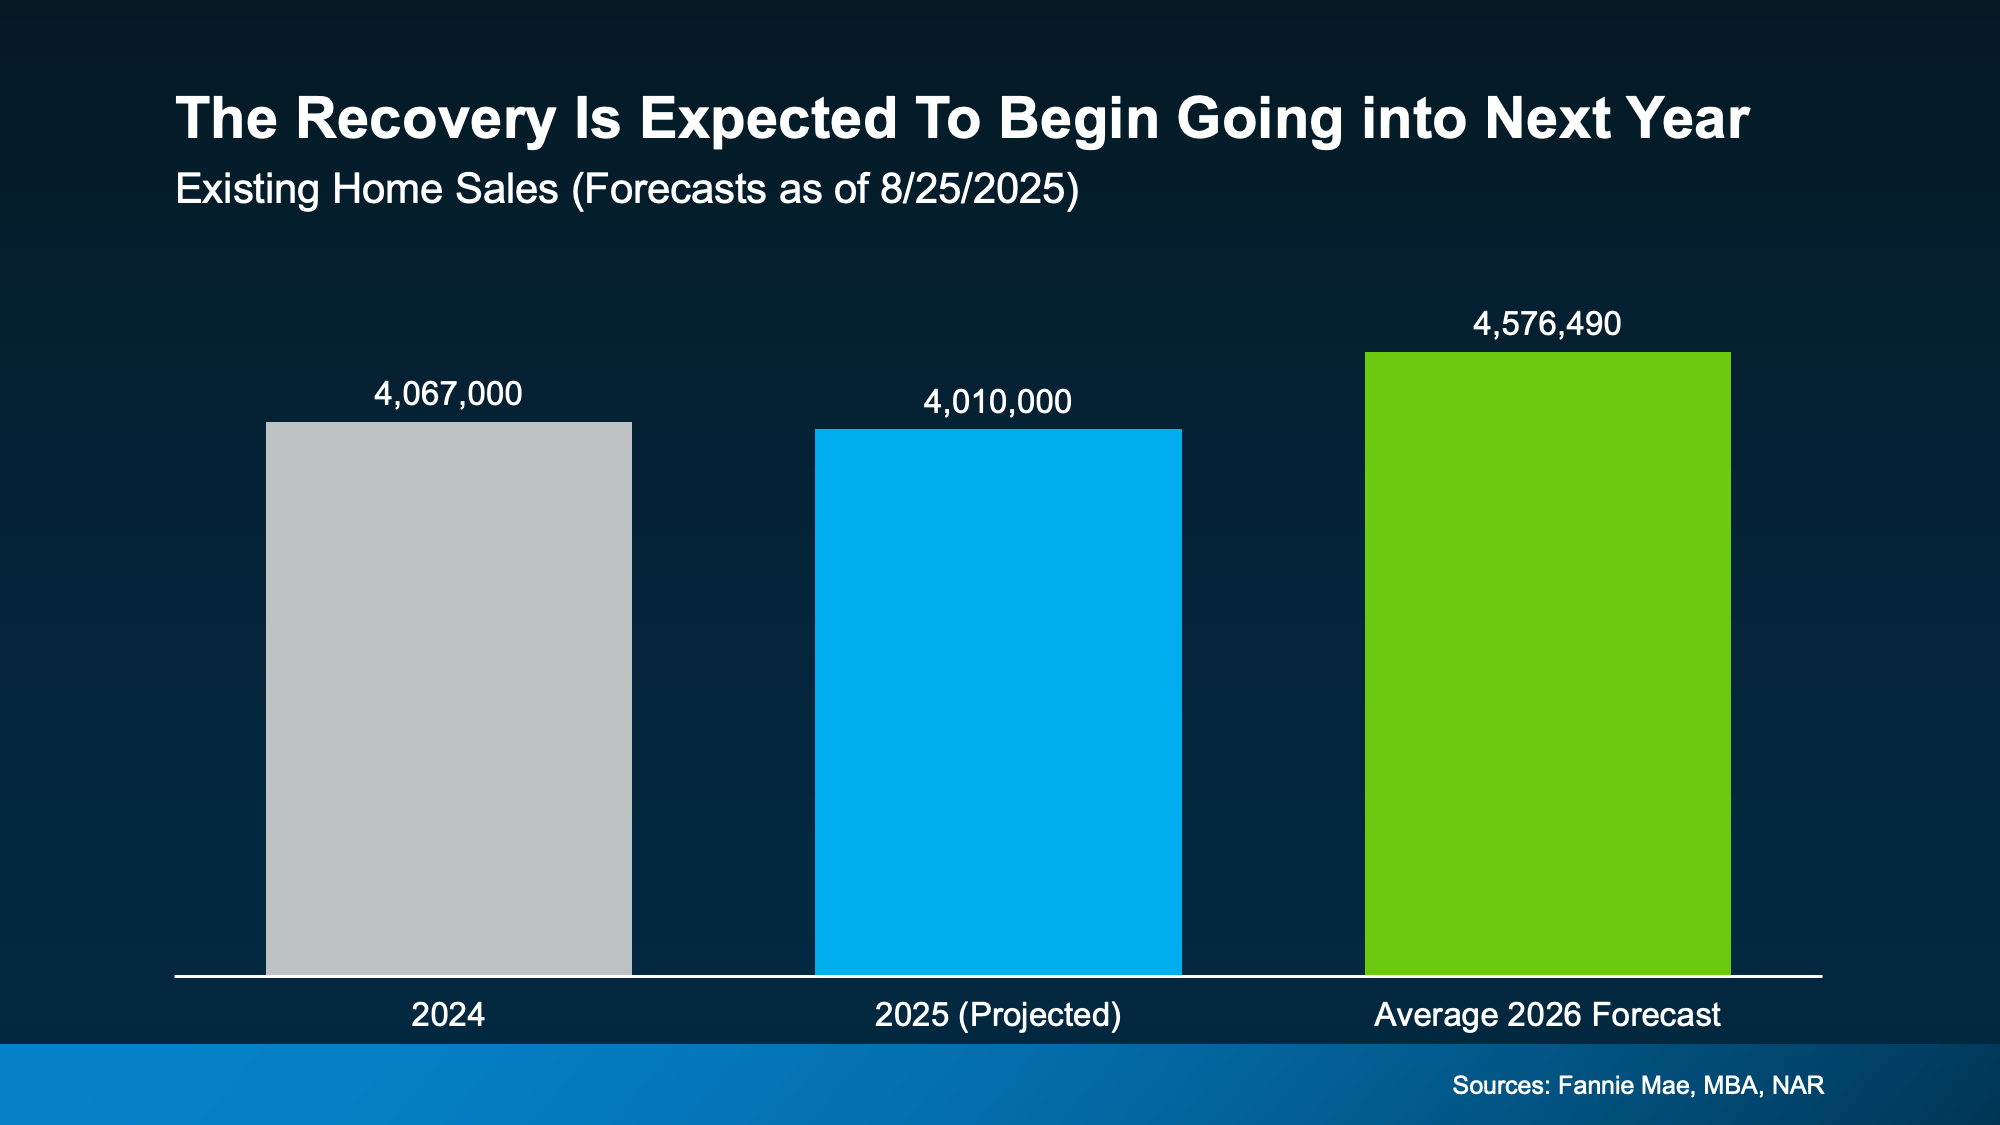
Last year, just about 4 million homes sold (shown in gray in the graph below). And this year is looking very similar (shown in blue). But the average of the latest forecasts from Fannie Mae, the Mortgage Bankers Association (MBA), and the National Association of Realtors (NAR) show the experts believe there will be around 4.6 million home sales in 2026 (shown in green).
And a big reason behind that projection is the expectation that mortgage rates will come down a bit, making it easier for more buyers to jump back in.
 That means what’s happening now is part of a cycle we’ve seen before. Every slowdown in the past has eventually given way to more activity, and this one will too.
Just like the 1980s, 2008, and 2020, today’s dip in home sales is temporary.
What That Means for You
If you’ve paused your moving plans, you did what you thought was right. Your frustration is valid. But it’s also important to remember the bigger picture. Housing slowdowns don’t last forever.
That’s where your local real estate agent comes in. Their job is to keep a close eye on the market for you. When the first signs of a rebound appear, they’ll help you spot the shift early so you can relist with confidence.
Discover how the housing market's proven resilience has led to consistent recoveries throughout history. Learn key trends and what they mean for today's market.
- housing market recovery
- real estate market trends
- housing market history
- real estate recovery
- housing market resilience
- housing market crash recovery
- real estate bounce back
- housing market cycles
- property market recovery
- residential real estate trends
- housing market patterns
- real estate market analysis
- housing recovery timeline
- how long does housing market take to recover
- housing market recovery after recession
- historical housing market recoveries
- real estate market always recovers
- housing market crash and recovery patterns
- why housing market recovers from downturns
- housing market recovery statistics
- real estate market resilience through history
- housing market recovery examples
- factors that drive housing market recovery
- US housing market recovery
- American real estate market trends
- national housing market resilience
- regional housing market recovery
- housing market recovery facts
- real estate market recovery data
- housing crisis recovery timeline
- historical real estate downturns
- investing during housing market recovery
- buying homes during market recovery
- real estate investment opportunities
- housing market recovery predictions
- economic recovery
- market volatility
- property values
- home prices
- mortgage rates
- real estate bubble
- market correction
- economic cycles
- financial crisis
- market stability
Throughout American history, the housing market has demonstrated remarkable resilience during economic downturns. The National Association of Realtors consistently tracks recovery patterns, while Federal Reserve data shows how monetary policy supports market stabilization. During the 2008 financial crisis, Freddie Mac research documented the eventual rebound, and Fannie Mae forecasts helped predict recovery timelines. The U.S. Census Bureau housing statistics reveal cyclical patterns, while Zillow market analysis provides real-time recovery insights. Financial institutions like Wells Fargo and Bank of America offer historical lending perspectives, and Realtor.com tracks pricing trends. Even S&P CoreLogic Case-Shiller home price indices confirm that patient investors who understand these cycles consistently benefit from the market's inherent ability to recover and grow over time.
Bottom Line
If today’s housing market feels stuck, remember it’s never stayed down for good. Slowdowns end, activity returns, and people get moving again. So, let’s connect, because when the next wave of buyers shows up, you won’t want to miss it.
As activity picks up again, will you be ready to put your house back on the market, or do you need to move sooner?
Categories
Recent Posts